The need for spending increased with World War I and became entrenched after World War II. Modern budgetary economics dates from that era. Boom and bust cycles could now be explained by what we call welfare economics. We can now measure economic growth (changes in Gross Domestic Product) and see how we are doing before catastrophe strikes.
Gross Domestic Product (GDP) is determined in theory and economic policy by the following equation. GDP=Government Purchases + Household Consumption + Investment in Plant and Equipment + Net Exports – Imports. Investment is not mean happens on Wall Street or the Commodities Markets. These deals are done with monopoly money and affect the mix of savings. Sadly, many economists and journalists conflate the two.
The yeast in every economy is when the government buys things, pays people and transfers money to the poor and retired. This leads to household spending, leading to household spending in the non-government sector as well. All of this causes investment in plant and equipment – regardless of how it is funded.
Government's impact comes in more than just buying stuff. It is a major contributor to household consumption through other and including the stuff it buys. It buys or creates natural resources (food, oil, land, and water), supplies, buildings, military assets, health care (military, civil service, old age, disabled, Indian, international, indigent), transportation infrastructure roads, airports, bridges, spaceports, and private capital used to make government purchases.
Government distributes current and future household income via employee salaries, military pay, government pensions, old age, survivors and disability income, interest on government trust funds, contractor pay and benefits, Temporary Assistance to needy Families, Food Stamps, supplemental security income, temporary disability income, refundable income and child credits, pays net interest to bondholders, and distribution of resource payments to tribal nations (land rentals and resource extraction). This amounts to more than half of household income resulting in consumption and savings.
Consumption from these income streams also creates private sector income, leading to consumption and savings (second and third order - which is private sector spending and savings resulting from private sector consumption). All of this leads to investment in land, plant and equipment for household consumption and exports.
Tax collections and double counting are the means by which all of this spending goes round and round. The double and triple counting is what is known as the multiplier effect.
Government spending is stable over time, which is why it is so hard to cut the budget by following this path. Most of the volatility is in tax policy. When taxes are increased, the budget deficit goes down. When they are cut, the budget deficit increases.
The deficit or surplus is a barometer of whether we are about to grow or shrink the economy. In the financial markets, when the deficit is equal to what we spend on net interest, injections and leakages from fiscal policy balance out. When they are not equal, we can tell how the economy is likely to go. If fiscal policy is extracting money from the savings sector, the deficit goes down AND more government spending and household spending results, making GDP higher. If fiscal policy is shifting money from consumption to savings through tax policy, the economy slows unless offset with more spending or higher transfer payments.
Predicting Growth
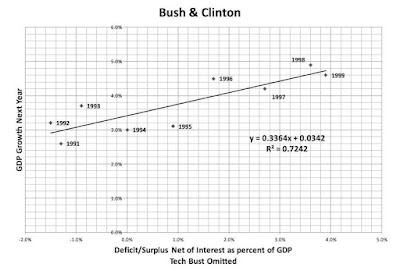
… The real revolution happened under Reagan, however, in a three round tax cut and subsequent comprehensive tax reform. The latter changed the basic structure of tax rates in a way that has seen adjustments, but no revolutionary change, since then. For this reason, we will demonstrate how taxing and spending interact from that point. The Reagan expansion was not due to tax cuts. It was due to high deficits that resulted from deficit spending. As this chart clearly shows, The larger the deficit, the more economic growth the next year.
After the 1990 budget deal, which reduced tax rates on the upper middle class (33%) and increased rates on the upper class (28%) to a flat 31% rate. Capital and labor rates were the same and as effective payroll tax rates decreased, the income tax rate kicked in, yielding a 30% flat tax for most taxpayers. That increase on top taxpayers shifted more savings toward consumption.
When Democrats control fiscal policy, taxes on the wealthy go up. This not only fuels the economy with increased spending, but it extracts money from savings for consumption directly, rather than through bond markets (at interest). Because spending is mostly stable (most increases are simply catch up spending), a GDP growth rate of around 3% results.
President Clinton raised taxes to 36% with a 10% surtax (3.6%), further increasing growth. The resulting expansion continued until the tech boom and bust, which was triggered by a lowering of the capital gains tax rates. This made taxes lower for investing in or starting an IPO than working.
The way to increase growth beyond average is to increase federal and contractor wages and transfer. payments, especially the latter. The recipients spend most of the money. Eliminating welfare as we know it under President Clinton helped balance the budget, but cutting capital gains taxes created the tech bubble and the resulting recession. Lower transfer payments made the recovery that much harder.

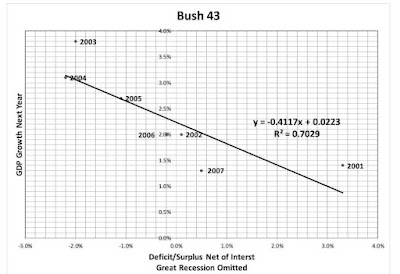
When President Bush 43 took office, tax cuts were already in the agenda. There were concerns that a balanced budget would create a shortage of federal debt to back monopoly money for the rich. The tech bust provided additional justification for tax cuts. This repeated the Reagan economy, where deficit spending was required to keep up with the tendency to shift profits from consumption and offset two rounds of tax cuts. Lower capital gains rates fueled an investment bubble. Slower consumption and income growth caused the Federal Reserve to cut interest rates and fuel an asset bubble. This gave us the Great Recession.

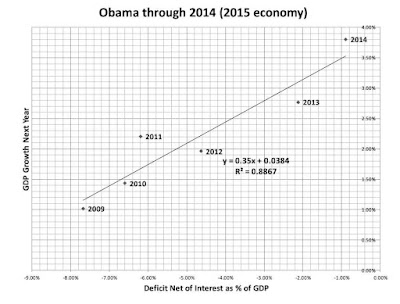
In reaction to the Great Recession, President Obama increased spending. Had he let the Bush Tax cuts expire on schedule, the recovery would have been more vigorous due to less saving, more consumption and higher incomes. Insisting that the Federal Reserve mark mortgage debt to market would have been more effective.
The Budget Control Act of 2011 marks were devised to avoid a self-inflicted debt limit crisis and to conform to baseline requirements to fund making the tax cuts in the Economic Growth and Tax Relief Reconciliation Act of 2001 and the Jobs and Growth Tax Relief Reconciliation Act of 2003 permanent for all but the richest 2% of households. There was no appetite for making detailed tax and spending fixes that would raise revenue from wealthier taxpayers. A quirk in baseline calculations allowed the prior tax cuts to expire and be reinstated for the bottom 98% under the American Taxpayer Relief Act of 2012. This likely added almost a point to GDP growth.
The ATRA of 2012 (passed January 2, 2013) increased tax rates on what is now the top $1.225 trillion of salary, leaving increases on those who now pay over $6 trillion on the table. Over the last six years, that left $600 billion dollars of revenue on the table. Making the upper middle class pay at Clinton rates would have let us tax enough to avoid that amount of spending cuts – or allowed less stringent collection of student loans. Without publicly financed elections, the upper middle class is more influential in some ways than the top 1433 families.

After the 2013 uptick in growth, spending increases for the Great Recession expired and were not renewed. The economy flattened in 2015, probably in response to budget cuts the prior year, slowing to an average 2% growth rate. Higher taxes would have meant more spending and less accommodation of speculation by the Federal Reserve would have kept more money out of the make-believe world of Wall Street.
President Trump’s focus on the wealthy and the bad tax cut bill started to make matters worse. The first data point after the Tax Cut and Jobs Act is a full point of GDP below his first year in office (which was due to Obama’s tax policy (and therefore, his economy). After that, the COVID recession and recovery are outliers, because it was a designed recession, not one that was the result of fiscal policy.

0 Comments:
Post a Comment
<< Home